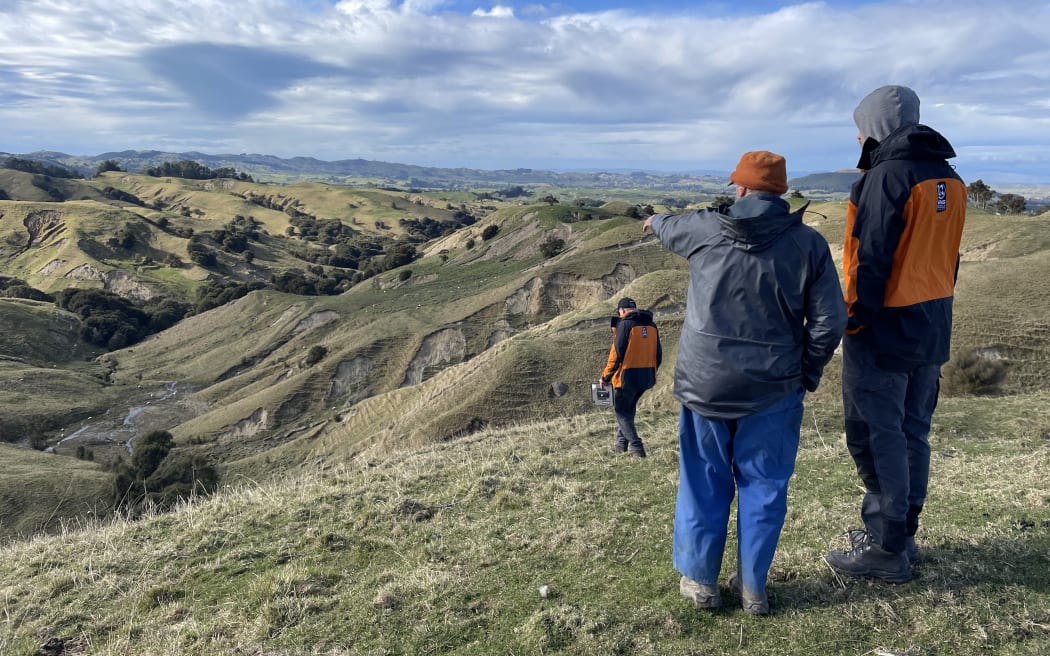
Scientists at Trigham Station in Hawke's Bay, surveying the land following Cyclone Gabrielle. Photo: Supplied / Janine Bidmead, GNS
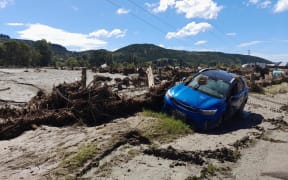
From reefs to rugged hillsides, scientists have been mapping the damage caused by Cyclone Gabrielle to help inform future decisions about where to build, and how storms impact the environment.
Ross Sneddon, a coastal environmental scientist with the Cawthron Institute, was part of a team tasked with mapping the Napier harbour, part of business-as-usual monitoring for the port's consenting process for dredging the harbour to deepen the approach for big ships.
But after the cyclone, it took scientists six months to get a clear three-day window to see anything around Pania Reef, thanks to all the sediment washed down the rivers into the harbour and continually churned up by large swells.
They were scheduled to go in April, but in the end they were not able to get out there until late October.
"The real problem with scheduling the monitoring activities is due to variations in underwater visibility. It's a fairly swell prone open coastal site, and it's very often got low visibility," Sneddon said.
And with most of their monitoring visual or photographic, they had no choice but to wait for a clear window.
It could not all be attributed to Cyclone Gabrielle, however.
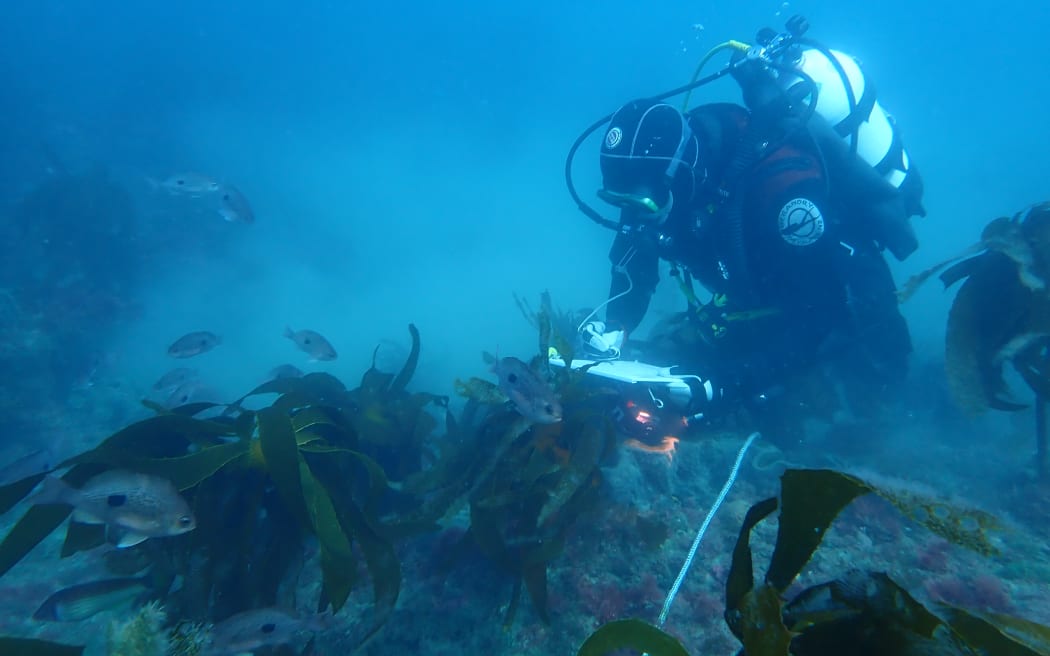
Ross Sneddon during a December 2021 survey of Pania Reef following the seabed transect line and recording data on a slate. Photo: Supplied / Scott Edhouse
"The other problem is that we're in a La Niña weather phase, and that gave a lot of easterly weather and swell conditions," he said. "To be quite honest, it's probably a combination of both."
Having reviewed the photographs, Sneddon said there was "a noticeable difference in the prevalence of silt on the reef compared to earlier years".
"Silt has always been a feature, and the organisms that make up the reef communities reflect that, favouring silt-tolerant species.
"So while the communities eight months on seem, for the most part, to have held up well, the increase in silt has been noticeable."
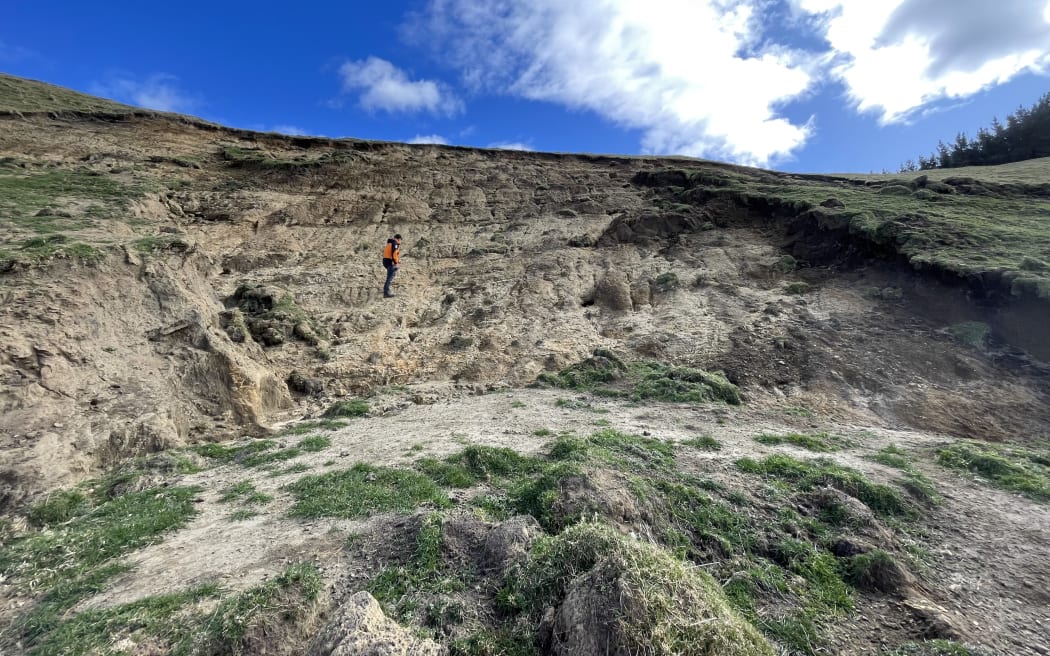
Patoka Station in Hawke's Bay. Photo: Supplied / Janine Bidmead, GNS
Back on land, the hillsides where that silt might have originated are the focus of a different project.
Dr Chris Massey, an engineering geologist and principal scientist at GNS Science, is part of a team trying to understand what drove and triggered landslides.
Rainfall, earthquakes, or human activity, together with other "susceptibility factors" like the slope material, how steep it was, the vegetation cover, drainage, and climate of the region, could indicate how likely a landslide was to occur, and how big.
These factors differed between regions, and some regions were well-studied, and others, not so much.
More than 140,000 landslides were mapped on the East Coast and Hawke's Bay following Cyclone Gabrielle.
"It is the largest data set of mapped landslides that we can attribute to a single event, in New Zealand, and I think it's potentially a world-leader in that sense," Massey said.
And they had only mapped a fraction of the total impacted area, focusing on areas of high population density, crucial infrastructure and access roads.
If the data was extrapolated to the actual affected area by the cyclone, Massey said, it could be more than 800,000.
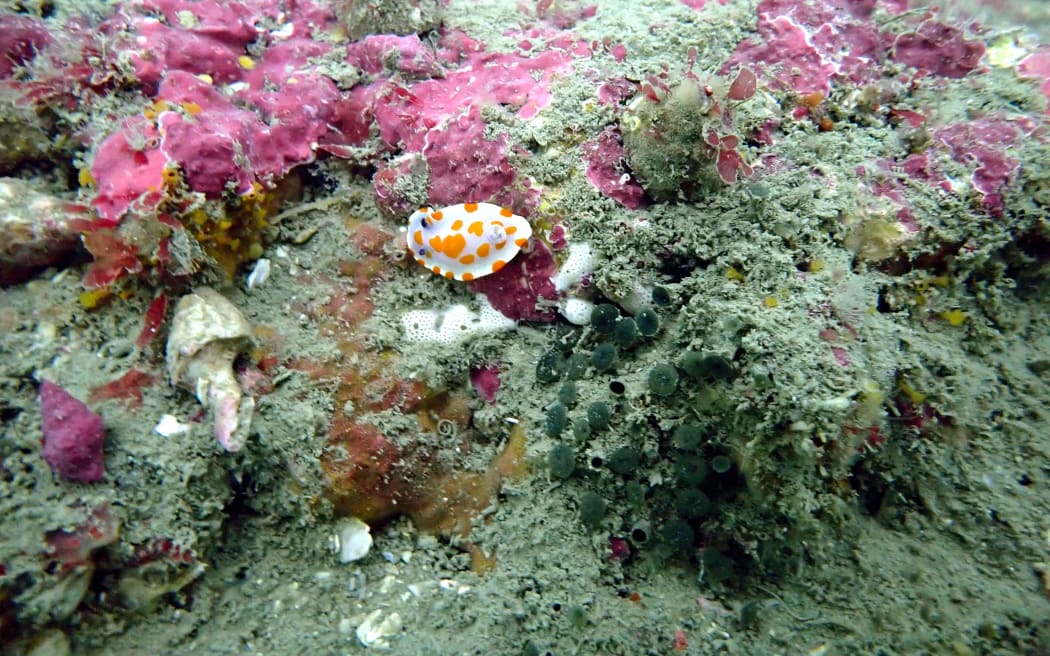
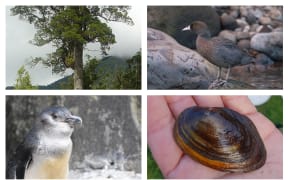
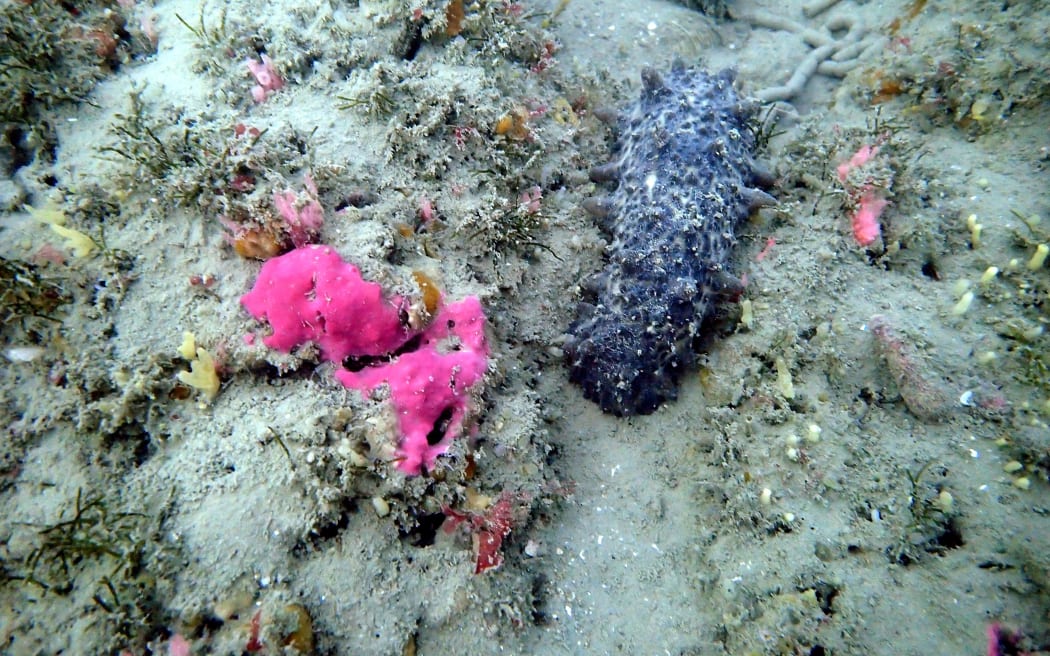
Scientists say the pictures show the profusion of life which still exists on the reef despite the hammering it took in February and since. Photo: Supplied
Going back 40 years, Massey said, they would not have been able to create a data set like this. Technology was advancing, making mapping easier, including satellite images.
Massey said the plan was to collate the data and then mine it - that is, link factors (sometimes using artificial intelligence) like rainfall and vegetation type, soil depth or slope gradient to come up with a forecast for future landslides.
"Our interest is to get the datasets and models together so that we can help the councils, show them areas that are not very good, and then it's up to [them] to put rules in place to limit the exposure of people and infrastructure [so] that we don't have to buy people out after an event."
GNS has now released "Landslide planning guidance: reducing landslide risk through land-use planning" to teach councils how to use this data to make planning decisions.
Taken in October this year, the silt buildup is obvious in the Napier harbour. Photo: Supplied / Ross Sneddon & Port of Napier Ltd
But Massey said there were still gaps in the data - only 30 per cent of the country was mapped, mostly due to a lack of research funding - but a new research programme called "Hazard, risk and impact modelling for fast moving landslides" hoped to fill them.
It was awarded more than $10.4 million from the 2023 Endeavour Fund in September.
"By the end of the second year, we hope to have some basic models for landslide forecasting for the whole country," Massey said.
Those could then be used as "impact forecasts", which were rapid forecasts for first responders like NEMA and CDEM groups to understand the scale of the impact, as well as longer term planning decisions.
Events like Cyclone Gabrielle were often the catalyst for research funding - a silver lining despite the impact of the disaster.