It was surely pure coincidence that the day Stats NZ chose to release its labour market numbers about jobs and wages was also International Workers Day.
Trade unions voiced their concerns, but the attention was on unemployment, salaries, jobs, and it was a mixed bag.
Here's what you need to know about the unemployment rate and how it's calculated.
Who is classed as unemployed ?
Stats NZ defines an unemployed person as someone: who has no paid job; is of working age; is available for work; and has looked for work in the past four weeks or has a new job to start within the next four weeks.
It asks about 15,000 households in the Household Labour Force Survey (HLFS), what their employment situation is.
It also trawls through information supplied by businesses about the hours worked, wages and the level of overtime, the number of full time and part time employees.
At the same time it estimates what the size of the labour force is, the size of the working age population, and the net effect of migration.
Then it reaches for the calculator divides the number of unemployed by the size of the labour force.

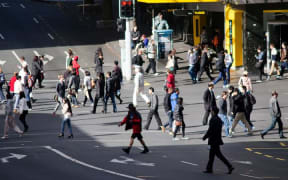
Stats NZ defines an unemployed person as someone: who has no paid job; is of working age; is available for work; and has looked for work in the past four weeks or has a new job to start within the next four weeks (file image). Photo: 123RF
What happened in the March quarter?
The labour force grew by 4000 - reflecting the immigration surge.
The economy lost 6000 jobs.
More people chasing fewer jobs.
The number of unemployed was estimated to have risen 10,000 to 134,000 divided by 3.07 million = unemployment of 4.3 percent.
Are the Jobseeker numbers a better measure of unemployment?
They are two different measures and there is some overlap. Jobseeker pays a benefit to those who may be unemployed, but who may not be able to work for various reasons, or who have opted out of the workforce.
However, the Stats NZ numbers capture those not just out of work, but looking for work, working casually, about to start a job, and are not claiming or are ineligible for benefits.
The number on the dole used to be used as an unemployment measure many years ago, but was regarded as unreliable, hence the move to the Household Labour Force Survey in the mid-1980s.
What about wages?
At the peak of the labour shortages wages rose markedly, touching close to 5 percent annually by one measure (the labour cost index) and by 7.6 percent for some specific jobs (quarterly employment survey)
But it is now an employers' market - more people to choose from for fewer jobs which lowers the wage pressures.
That pleases the Reserve Bank which regards labour costs as a key driver of inflation.
Why is it all turning soft?
As former US President Bill Clinton said one election campaign: "It's the economy, stupid".
At the height of the pandemic New Zealand closed the borders, and imposed lockdowns. That resulted in many foreign workers going home, while preventing Kiwis from coming home.
When the economy opened up businesses were short of workers, and the unemployment rate fell to a record low of 3.2 percent in December 2021 as a smaller workforce chased jobs galore.
Businesses complained long and loud about not being to get staff. For much of 2022/23 the inability to find staff was the biggest problem for businesses, not the lack of sales. The relaxation of immigration rules resulted in a record migration gain of 140,000 through 2023, filling much of the labour shortage.
Throw in inflation pushing through 7 percent, and the Reserve Bank hiking interest rates to slow it down, the economy was bound to slow.
The labour market is known as a lagging economic indicator, as firms hang on to staff for as long as they can, even as sales and orders fall, and costs remain high.
But the employment tables have turned in the space of a little more than two years.
What is the employment outlook?
Bleak is the most cheery description.
The latest numbers will have not captured much of the announced public service cuts, and private sector jobs losses have been relatively muted, so far.
But a slowing economy means fewer sales and less demand for staff, and that will mean more pressure on household budgets.
The highest levels since 1986 have coincided with major recessions and global crises - 10.7 percent in 1992, 7.7 percent in 1998, and 6.9 percent in 2012.
Local economists and the RBNZ pick unemployment to push above 5 percent next year, but it will need the economy to perk up and show real growth.
In the same way the labour market was the last to slow down, it will be among the last to pick up.


